You may have noticed the occasional solitary mound of snow just sitting there whilst all around there’s no other trace of the white stuff. The mystery of the mounds depends on several things - sun and the action of the snow ploughs in the city or the wind in the mountains. For this reason, estimating the total amount of snow that has fallen can be difficult, but it does help us to understand how much water we can reasonably use. A new study has just started using an innovative approach and radar waves to gain more insight into understanding the dynamics of snow.
A hundred years of history
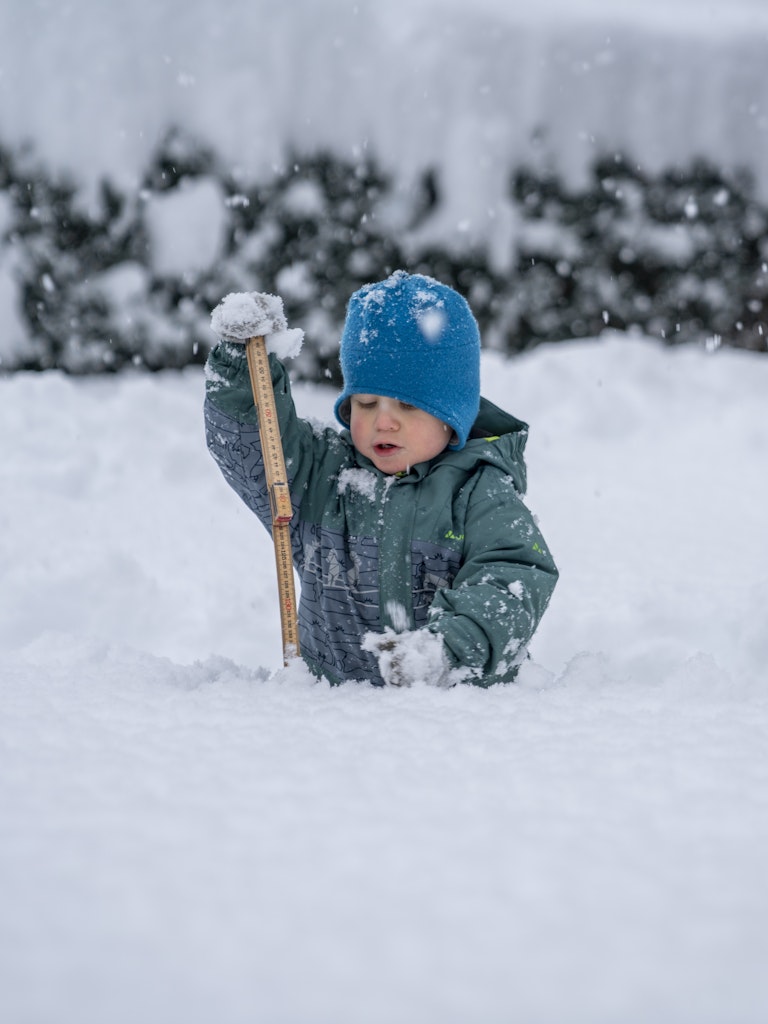
Autumn 1939, as the Second World War breaks out, the warden at the Mont Cenis dam, stranded at an altitude of 2,000 metres, on the border between Italy and France has a new task: to measure the falling snow. On the morning of 26 October, on the plateau near his hut, using a long measuring stick, he records a measurement of only two centimetres, the next day it’s increased to 20 and the day after that 28. The same warden repeated and noted down measurements all winter long and so did his successors, for over seventy years. The measurements recorded at Mont Cenis are one of the first historical series on snow depth in the Alps. These measurements, available on the website of the Italian Meteorological Society, which were unfortunately discontinued in 2014, are an example of the classic technique of measuring snow depth. The technique is undertaken where the ground is as flat and as protected from the wind as is possible and a graduated rod called a snowmeter probe is inserted into the ground. The 330cm rod/probe uses alternate yellow and black stripes, each ten centimetres high to enable an easily readable measurement. Since 1981 in South Tyrol, measurements have been recorded at the region’s 15 avalanche observatories. Every day during the winter season, data on snow depth and other parameters is sent to the civil protection office and some meteorological stations also carry out automatic measurements.
Point measurements and the struggle of satellites
Although essential, measurements with snow poles are expensive and sometimes risky. Often entailing repeated climbs to high altitudes in difficult conditions. Today, some stations use more advanced systems such as ultrasonic sensors resulting in automated and more accurate measurements. Regardless of the technology, ground measurements do have a limitation: they only refer to a specific point. In the mountains this can be especially misleading, winds and highly differing solar exposure from slope to slope mean that snow is often distributed very unevenly. In order to get a more accurate picture, the areas where snow surfaces are measured would have to be pitted like Swiss cheese.
This is where satellite images, which provide data over larger areas, should be able to come to the rescue. However, this combination of ground and satellite data - which works well for other parameters such as the extent of snow cover - is more problematic here. Currently, satellite techniques use radar sensors. Researchers set the right frequency for incoming electromagnetic waves from the satellite to interact with the snow grains. It's a bit like researchers tuning the satellite radio to the snow channel. If the signal encounters water particles, it sends a recognisable signal back to the satellite. But not all snow is the same, if it’s wetter or more powdery, the flakes - technically called grains – differ in dimension.
The electromagnetic waves interact intensively with the water in the snow, preventing interaction with the dry part, this means that not all the snow can be detected. When the snow is only dry, in most cases it is transparent; in the presence of liquid water, the electromagnetic waves interact essentially with the water. The result is that the snow station, even though it communicates, doesn’t always tell the whole story on snow.
What about these bats then?
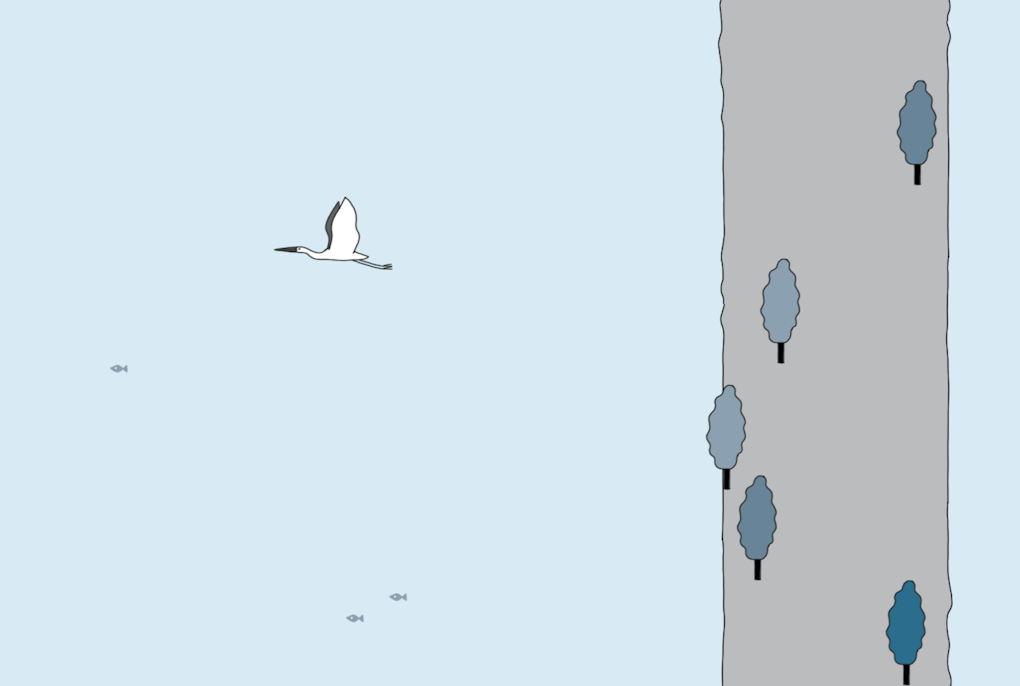
For some years now, Earth observation scientists have been trying out new approaches. If they can’t measure the "what", i.e. the snow, they measure the "time", i.e. how long it takes the electromagnetic waves to reach the ground beneath the snow and return to the satellite. It’s the same principle used by bats - they launch a wave and wait for its echo to return. Depending on the time it takes, they can see whether there is an obstacle in front of them. In a similar way, electromagnetic waves from satellites pass through snow, touch the ground and return to their base. Depending on the thickness and type of snow cover that the waves encounter on their way, the time needed for a round-trip, varies. This time interval is technically called a 'phase' and this technique may allow the snow’s total mass to be assessed, indirectly giving the value of the water content and of the snow depth.
On the left is a snow-free surface. The satellite signal (red line) touches the ground and returns to the base following a linear path. Right: the snow deflects and interacts with the signal (blue line) which, in order to return to the satellite, takes a more complex route than it would have done had it not encountered the snow (dotted red line). © Eurac Research | Fabio Dalvit
This technique has not yet been widely tested. Some trials have been carried out since 2005 in several pilot areas in Europe and the USA. In Europe, more in-depth studies are underway. One of them is Alpsnow, a project which sees a collaboration between the Eurac Research Institute for Earth Observation, the European Space Agency, the Autonomous Province of Bolzano and various Alpine partners.
A technology thermometer
The Technology Readiness Level is the scale that measures how 'ready to use' a piece of technology is. It ranges from one to nine: one indicates a scientific idea and nine a fully automated technological tool. The scale, developed by NASA in 1974, places technology at the top of the scale only if it can be used by an astronaut, in space. The Alpsnow project is currently at the first part of the scale. The idea has been tested in some cases, but there are several aspects to refine and consolidate: data management and large-scale testing need to be improved before we get to an operational system.
As far as snow measurements are concerned, there are also high expectations for the new generation of Sentinel satellites, which are due to be launched at the end of this decade. Calculating the availability of snow each year, and its equivalent in water, is essential for a more intelligent use of natural resources.
The Alpsnow project
Five test areas, including one in the Schnalstal valley in South Tyrol, nine partners and two years to develop new algorithms and software to better monitor the snowpack in the Alps. The research team is currently using ground measurements as well as satellite data and physical models, focusing on six parameters in particular: 1) water equivalent of snow, 2) snow height, 3) albedo (i.e. how much the snow reflects the sun's rays), 4) grain size, 5) water content and 6) extent of the snowpack. "There are global patterns, but they are not very suitable in the mountains," points out physicist Claudia Notarnicola, head of Eurac Research’s part of study. "Here, you have to take into account topography, shadows caused by reliefs, persistent cloud cover and above all the forests because tree canopies don’t allow sensors to penetrate". http://alpsnow.enveo.at/index.html
Translated by Rachel Wollfe


